CAChe Molecular Modeling: Computer Aided Chemistry
Chem445 CAChe Workbook
Contents:
I. Crystal Structures and YBa2Cu3O7-x
II. Ferrocene
III. DMSO/AlCl3 Model
IV. CAChe Optimization and Spectra Generation: A
Step-by-Step Guide, Using Be(acac)2 as a Model Compound
V. LixWO3, an Intercalation Material
VI. ZSM-5, an Open Framework Aluminosilicate
I. Crystal Structures and YBa2Cu3O7-x
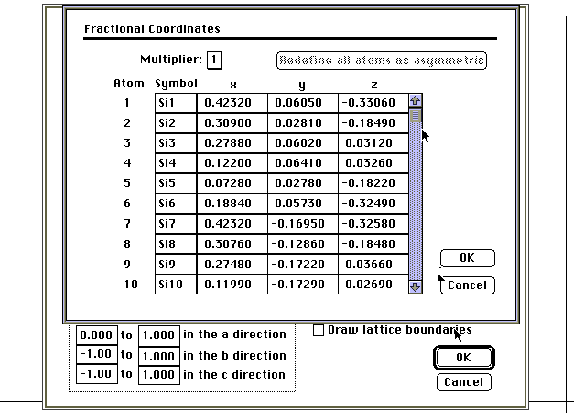
The crystal shape feature of the CAChe modeling program may be used to build asymmetric atoms, molecular crystals and infinite lattices. This will be particularly useful and informative when used in conjunction with the zeolite and LixWO3 laboratories. In order to use this feature, three items are necessary: a space group, cell parameters and the fractional coordinates of the asymmetric atoms.
For example, the space group of the superconducting compound YBa2Cu3O7-x is Pmmm. The cell parameters are a = 3.82030Å, b = 3.88548Å and c = 11.68349Å.1
|
Atom |
x |
y |
z |
|
Y |
0.5 |
0.5 |
0.5 |
|
Ba |
0.5 |
0.5 |
0.18393 |
|
Cu(1) |
0 |
0 |
0 |
|
Cu(2) |
0 |
0 |
0.35501 |
|
O(1) |
0 |
0.5 |
0 |
|
O(2) |
0.5 |
0 |
0.37819 |
|
O(3) |
0 |
0.5 |
0.37693 |
|
O(4) |
0 |
0 |
0.15840 |
Table 1. The fractional coordinates of the asymmetric atoms
of YBa2Cu3O7-x contains eight atoms.1
With this information, you may build the infinite lattice of YBa2Cu3O7-x. Open a new file and save it in the Chem 445 folder. Select the appropriate space group and enter the cell parameters using the crystal shape command in the view menu. Click on the fractional coordinates dialog box and enter the fractional coordinates (the tab, return or enter keys allow you to move the cursor within the dialog box). The multiplier should be set at one, since the coordinates that you enter are divided by the multiplier to give the fractional coordinates. Select OK when data entry is complete and you will be returned to the first screen of the crystal shape dialog box. Select the "Build" option and the "Asymmetric atoms" option to view the asymmetric atoms entered in the fractional coordinates dialog box. You may return to this option and start fresh at any point. Next, select "Build" and "Molecular Structure" to construct the lattice. You may then adjust your lattice boundaries and "Build" the "Infinite Lattice" by specifying the number of unit cells that will appear on the screen. Also in the crystal shape dialog box, you may select the "Draw" function and draw an outline of the asymmetric cell, unit cell, or boundaries of the portion of the crystal that you are seeing.
References
1. Williams, A.; Kwei, G. H.; Von Dreele, R. B.; Larson, A. C.; Raistrick,
I. D.; Bish, D. L. Phys. Rev. B 1988, 37, 7960.
II. Ferrocene
1. Find the eclipsed ferrocene model in the fragment library using the
fragment tool (ligand-p-complex). Using atom
tools, examine the hybridization and charge of each atom until you are
satisfied that you understand their method of construction. You will use
this knowledge to construct a staggered ferrocene molecule.
In the library molecule, you should find that the charge
of iron is +2
and the overall charge on each ligand is -1. You may verify (using the
atom tool and the alt/option key) that in each cyclopentadienyl ligand
there are four carbons with a zero charge and sp2 hybridization
and one carbon with a -1 charge and sp2 hybridization. What
other things can you deduce by examining the eclipsed ferrocene model? What type of bonds are the h-5 bonds between
the cyclopentadienyl ligand and the Fe2+ atom?
2. Now you are ready to build the staggered ferrocene model from the
cyclopentadienyl ligand fragment (Cp), which is also in the fragment library.
Use the beautify option to remove the lone pairs on the cyclopentadienyl
ligand fragment that will be your basic building block. Adjust the cyclopentadienyl
fragment until it meets the criterion that you obtained from part 1.
Next, use the atom tool (atom/periodic table) to select an Fe2+
atom. Bond it to the cyclopentadienyl ligand (tool/atom: drag from the
center of each carbon atom to the center of each iron atom; rotate if necessary
as you go along). Designate the type of bond (remember part 1). Now you
are ready to import a second cyclopentadienyl ligand (remember to stagger
the cyclopentadienyl ligands). Draw in your five carbon-iron bonds and
you are ready to optimize the geometry of the molecule using Mechanics
and ZINDO (you will leave the editor file at this point; the optimized
geometry will be available following ZINDO in the EDITOR file).
To obtain a UV-vis spectrum, choose the configuration interaction spectra
option (CI) in ZINDO. Select a level for CI (7 or 8 is adequate for benzene; the
highest level that the instrument will optimize is 14 for a singlet or
9 for a doublet).
Open the molecule in VISUALIZER+ to view the UV-VIS spectrum.
Use the
Electronic Spectra command in the analyze menu to overlay the spectrum
and the molecule. You may put the cursor on the spectrum and select a point
that will highlight the molecular orbitals involved.
3. An alternative to building the staggered ferrocene molecule from two cyclopentadienyl ligands and one Fe2+ atom is to use the Fragment Tool to obtain a [(Cp)2Ni] staggered molecule from the Ligand-p-Complex option of the Fragment Library. The Ni2+ atom is changed to an Fe2+ atom by using the alt/option key in the Atom Tool. Verify the charge (2) and configuration (d2sp3, octahedron) of the iron atom. The geometry is then optimized using Mechanics and ZINDO, followed by Configuration Interaction, as in step 2, above.
III. DMSO/AlCl3 Model
See the DMSO experiment for a step-by-step guide using the monodentate DMSO (dimethyl sulfoxide) ligand and coordinate covalent bonds with Al as the model metal.
IV. CAChe Optimization
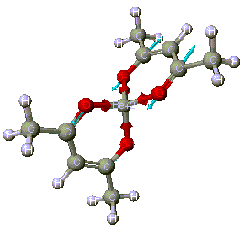
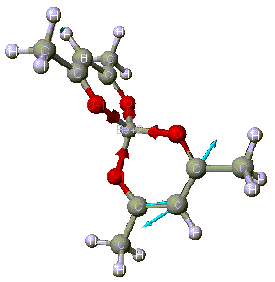
By examining the CAChe Periodic table, it is easy to see why Be(acac)2, [Bis(acetylacetonate)beryllium, [CH3COCH=C(O-)CH3]2Be, is selected as a model compound: CAChe can optimize compounds containing the beryllium atom using both MOPAC and ZINDO (Figure 1).
The steps for this optimization are order very specific. A step-by-step guide, along with depictions of the computer screen, will now be shown. The acetylacetonate ligand is known as a bidentate ligand because it contains two oxygen donor atoms. Beryllium compounds are highly toxic and cancer suspect agents. Computer modeling might save time in the lab.
Step 1: In Editor, draw the molecule or obtain the molecule from the "Fragment" library.

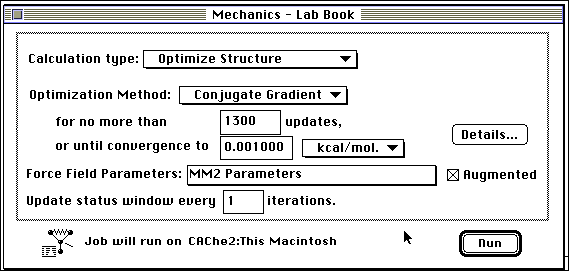
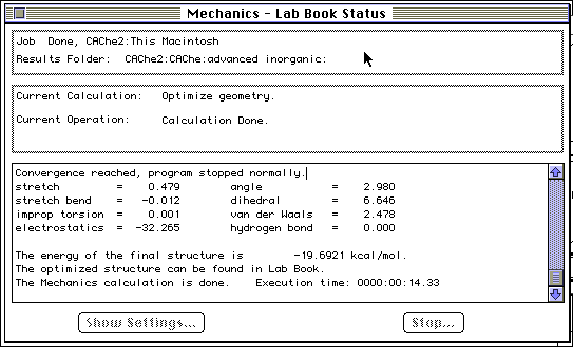
Step 2: Optimize the geometry in Mechanics, in the default mode (or increase updates to 1300, to insure that the molecule runs to completion). Remember that in Mechanics, structures are solved using classical mechanics. Optimization, whether classical (steric energy minima) or quantum mechanical, attempts to find the nearest stable geometry, taking into account all the interactions within the molecule.
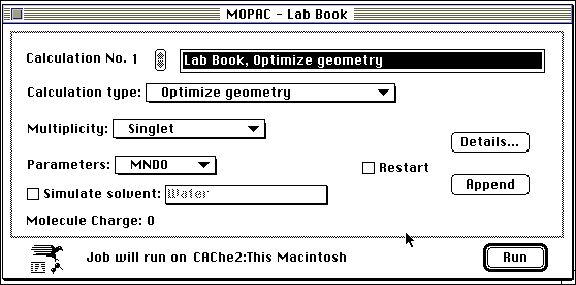
Step 3: Optimize the geometry in MOPAC (Molecular Orbital PACkage). MOPAC is a quantum mechanical optimization program and calculates the heat of formation, bond strengths, atom hybridization, partial charges and orbitals. Examine the CAChe periodic table to insure that all elements in the molecule to be optimized have a black square in the upper right hand corner. Verify the molecular charge displayed on the screen. The system will suggest changing the multiplicity and parameters when necessary. You may have to change the parameter set (MINDO/3, MNDO, PM3 or AM1). Solvents may be simulated. Refer to the CAChe Manuals for further explanation.

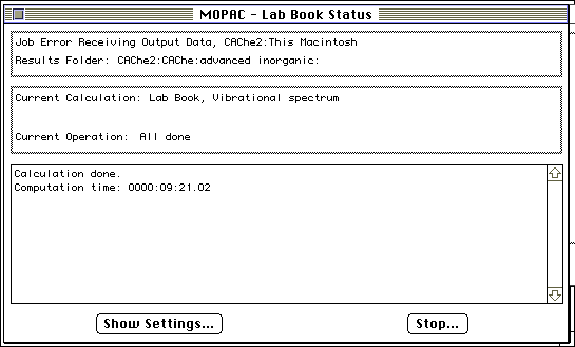
Step 4: To calculate the vibrational spectrum, use the vibrational frequency (force) option in MOPAC with the same parameters as above.

Step 5: Open the molecule in "Visualizer" and choose "Vibrational Spectra" in the "Analyze" menu. The spectrum will be displayed.
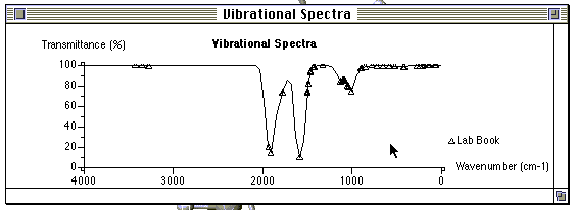
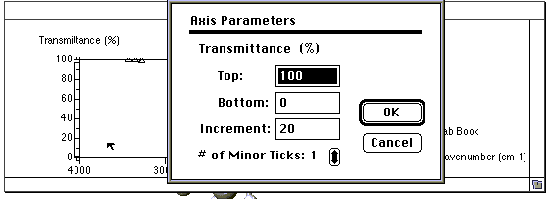
The axis parameters may be adjusted by double- clicking on either the x or the y axis and entering new values. The stretching modes responsible for each peak may be obtained by double clicking on a peak contained in the theoretical vibrational spectrum. The molecule will be displayed on the screen behind the spectra and may be brought to the foreground by clicking on the screen near the molecule. To obtain the spectrum a second time, go to the beginning of step 5.
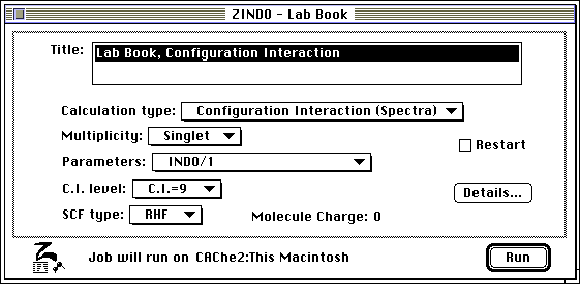
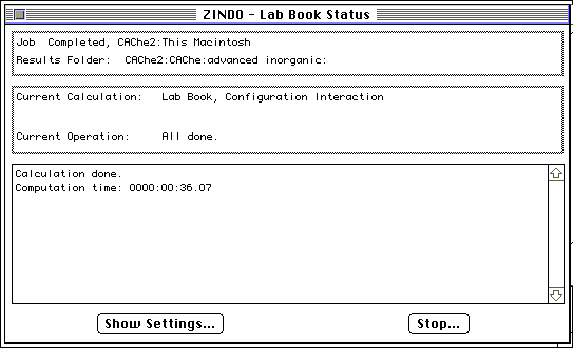
Step 6: Select ZINDO (Zernerís Intermediate Neglect
of Differential Overlap) within the Applications menu. Select
the Configurational Interaction (Spectra) option.
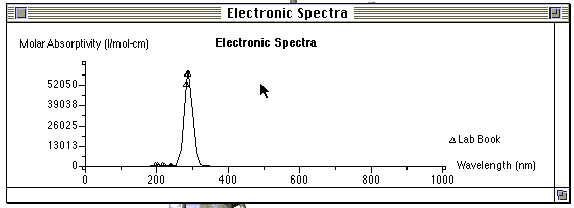
Step 7: Open the molecule in "Visualizer" and choose " Electronic Spectra" in the " Analyze" menu. The molecular orbitals responsible for each absorption may be highlighted by double clicking on the peak(s) contained in the electronic spectra. The molecule will be displayed on the screen behind the spectra and may be brought to the foreground by clicking on the screen near the molecule. To obtain the spectrum a second time, go to the beginning of step 7.

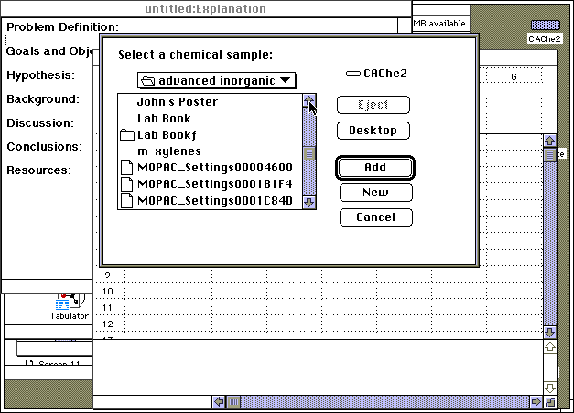
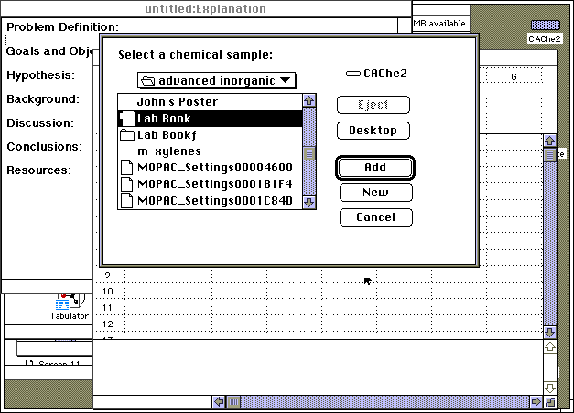
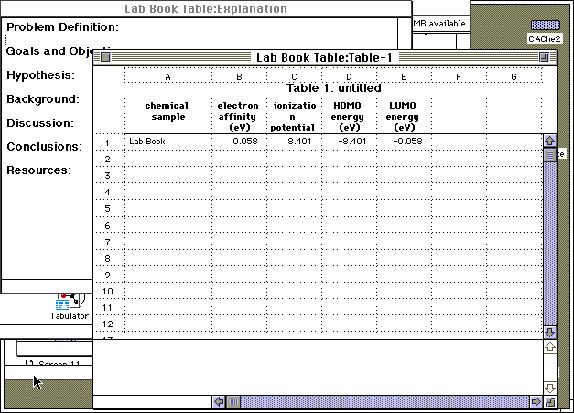
Step 8: A "Project Leader" table may be generated to tabulate the theoretical results of the above calculations. "Project Leader" is opened by double-clicking on its icon on the CAChe main screen. A new blank table will automatically appear, or an old table may be reopened. Title and save the new table. Double click on "1A", or any "A" field, under "chemical sample". Open the advanced inorganic folder and select chemical samples by "Adding" the compound of interest. The appropriate folder will be displayed in the roster with NO ICON to the left of the name. Do not add the samples with folder icons to the left of their name.
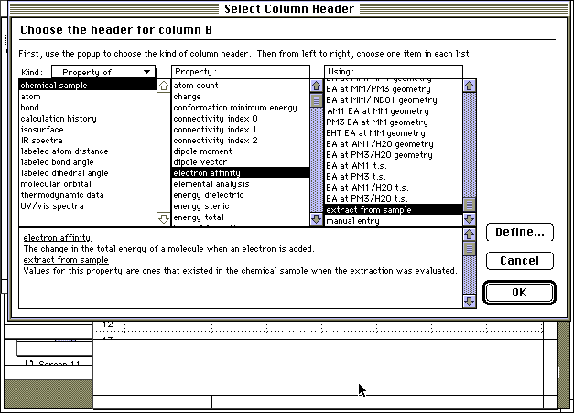
Step 9: Column headers are entered by double-clicking on the lettered (B, C, D etc.) fields. Notes are displayed at the bottom of each screen, defining each term.
Step 10: To receive data, highlight fields such as 1B, 1C, 1D, 1E. In the pull-down menu, select "Evaluate" and "Cells". Calculations will take place and parameters will be displayed. Save the table. At the completion of steps 1 through 10, each refined molecule will have an editor file, a folder, a potential energy surface map and a project leader table.
V. LixWO3, an Intercalation Material
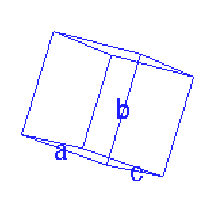
Figure 21. A view of the unit cell with cell parameters
displayed. By definition,
a = (b, c); b = (a, c); g
= (a, b).
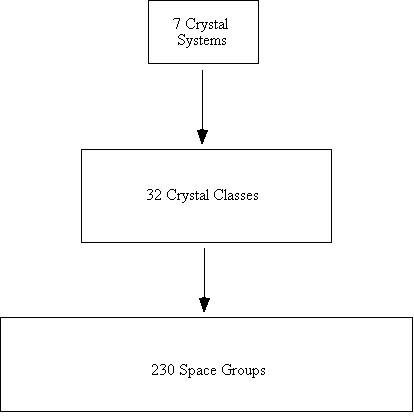
Figure 22. A flow chart of crystal systems and space groups.
Crystal Systems
1. Triclinic
no restrictions for a, b, c, a,
b, g
2. Monoclinic
no restrictions for a, b, c, b;
a = g = 90°
3. Orthorhombic
no restrictions for a, b, c; a
= b = g = 90°
4. Tetragonal
no restrictions for a or c, but a = b
and a = b = g
= 90°
5. Hexagonal
no restrictions for a or c but a = b,
a = b = 90°, g
= 120°
6. Trigonal
no restriction for a, but a = b = c;
no restriction for a, but a
= b = g
7. Cubic
no restriction for a, but a = b = c; a
= b = g =
90°
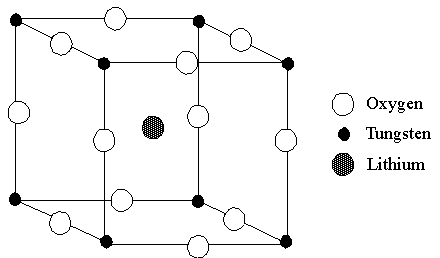
Figure 23. A view of the unit cell of LixWO3,
a cubic perovskite.
Following section I, above, the crystal shape feature may be used
to generate the unit cell or crystal lattice of LixWO3.
You must first decide which atoms belong to the asymmetric unit and assign their
fractional coordinates. The space group for the cubic perovskite is Pm3m.1
The value for a is 3.72 Å.2 A cubic structure by definition
has a = b = c.
References
1. Galasso, Francis. S., Structure, Properties and Preparation of Perovskite-Type Compounds; Pergamon Press: Hungary, 1969; p. 7.
2. Ibid., p. 23.
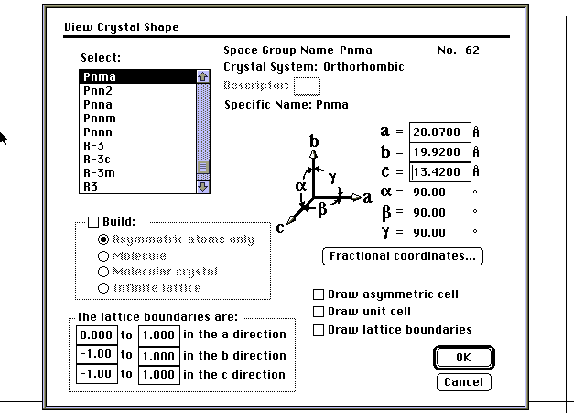
VI. ZSM-5, an Open Framework Aluminosilicate

To obtain the necessary fractional coordinates, space group and unit cell parameters, see: Olson, D. H.; Kokotailo, G. T.; Lawton, S. L.; Meier, W. M., "Crystal Structure and Structure-Related Properties of ZSM-5", J. Phys. Chem. 1981, 85, 2238-2243. They are also available at: http://www.iza-sc.ethz.ch/cgi-IZA-SC/collection. Follow the instructions in section I, above, to generate the framework. Ortho-, meta-, and para-xylenes may then be built and driven into the three dimensional channels, to obtain a visual estimate of the size of the channels, cavities and windows of the size/shape selective material.